배운 내용
- pd.read_csv(), pd.read_table(), pd.read_fwf()
- DataFrame.head(), DataFrame.shape
- DataFrame.info()
- DataFrame.describe()
- Series.value_counts()
- DataFrame.values
- DataFrame.to_dict()
- DataFrame의 칼럼 데이터 세트 생성과 수정
- DataFrame.drop()
- DataFrame.index, Series.index
- DataFrame.reset_index(), Series.reset_index()
- DataFrame[ ]
- DataFrame.iloc[ ]
- DataFrame.loc[ ]
- 불린 인덱싱
- DataFrame.sort_values(), Series.sort_values()
- Aggregation
- DataFrame.groupby()
- DataFrame.isna()
- DataFrame.fillna()
- DataFrame.apply(lambda)
데이터 핸들링 - 판다스
판다스의 핵심 객체는 DataFrame입니다. 다른 중요한 객체로는 Index와 Series가 있습니다.
Index는 개별 데이터를 고유하게 식별하는 Key값 입니다.
Series와 DataFrame은 모두 Index를 key값으로 가지고 있습니다. 하지만, 이 둘의 가장 큰 차이점은 Series는 column이 1개이고 DataFrame은 column이 여러 개인 데이터 구조체라는 점입니다.
판다스는 csv, tab과 같은 칼럼을 분리한 파일의 데이터 세트를 손쉽게 DataFrame으로 로딩할 수 있게 해줍니다.
기본 API
import pandas as pd
# 판다스 불러오기
케글의 타이타닉 competition을 통해 API를 설명한다.
먼저, https://www.kaggle.com/c/titanic/data에서 train.csv파일을 다운로드 받는다. 이름을 titanic_train.csv로 바꾼다.
파일을 DataFrame으로 로딩
pd.read_csv(), pd.read_table(), pd.read_fwf(), DataFrame.head()
read_csv()와 read_table()의 가장 큰 차이는 필드 구분 문자(Delimeter)가 ','인지 '\t'인지의 차이입니다.
read_table()의 default값은 '\t'입니다. 여기서 필드란 칸 하나 하나를 의미합니다.
read_csv('파일명 or 버퍼', sep='\t')으로 read_table()을 대체할 수 있습니다. delimeter의 값을 달리 주면, 어떤 필드 구분 문자 기반의 파일 포맷도 DataFrame으로 변환이 가능합니다.
read_fwf()는 Fixed Width, 즉 고정 길이 기반의 칼럼 포맷을 DataFrame으로 로딩하기 위한 API입니다.
DataFrame.head(N)은 N개의 Row를 반환합니다. default는 5개 입니다.
DataFrame.shape도 가능합니다. 행과 열의 크기를 튜플 형태로 반환합니다.
import pandas as pd

titanic_df = pd.read_csv('titanic_train.csv')
titanic_df.head(3)
''' 결과1 '''

print(type(titanic_df))
''' <class 'pandas.core.frame.DataFrame'> '''

titanic_df
''' 표가 전부 출력 '''

print(titanic_df.shape)
''' (891, 12) '''
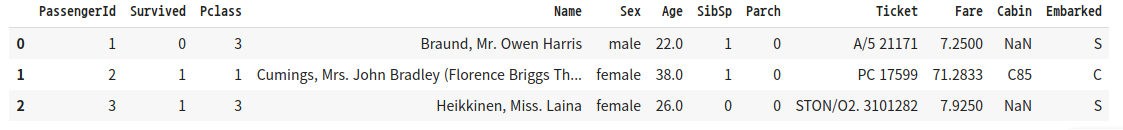
pd.readcsv()는 첫 번째 row에 있는 column를 칼럼명으로 인지하고 칼럼으로 변환합니다.
파일에 기재되지 않은 값인 0, 1, 2 .. 들은 pandas의 Index입니다. 모든 DataFrame의 데이터는 고유의 Index 객체 값을 가지게 됩니다.
DataFrame.info()
import pandas as pd

titanic_df = pd.read_csv('titanic_train.csv')
titanic_df.info()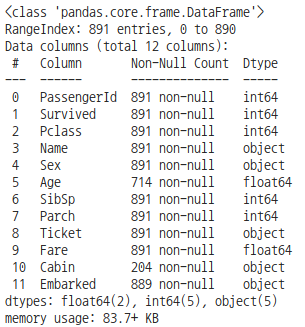
DataFrame.info()를 통해 총 데이터 건수, 데이터 타입, Null 건수를 알 수 있습니다.
- RangeIndex는 Index의 범위이다. 즉, Row의 수를 나타낸다.
- Data columns는 column의 수를 나타낸다.
- Non-Null Count는 해당 column 중 몇 개가 null이 아닌지 나타낸다. Age column 같은 경우 714/891개가 null이 아니다.
- Dtype은 column의 data type을 나타낸 것입니다.
- dtypes는 해당 data type의 column의 갯수를 괄호 안에 나타낸 것 입니다.
DataFrame.describe()
import pandas as pd

titanic_df = pd.read_csv('titanic_train.csv')
titanic_df.describe()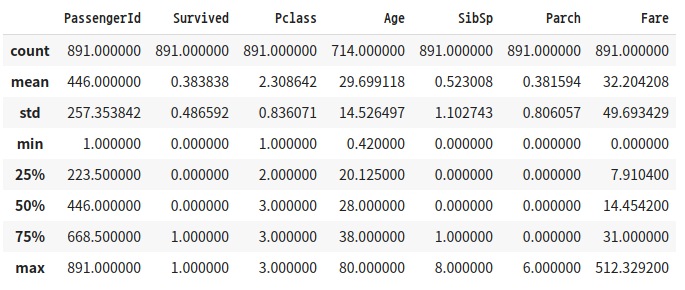
DataFrame.describe() 메서드는 칼럼별 데이터 분석값을 나타냅니다.
- Not Null인 데이터 갯수
- 평균값
- 표준 편차
- 최솟값
- n-percentile 분포도(20% 50% 75%)
- 최솟값
단, 오직 숫자형(int, float 등) 칼럼의 분포도만 조사하고, object 타입의 컬럼은 자동으로 출력에서 제외시킵니다.
describe() 메서드는 회귀에서 결정 값이 정규분포를 이루지 않거나 왜곡된 경우 예측 성능이 저하됩니다.
DataFrame['Column'].value_counts()
import pandas as pd

titanic_df = pd.read_csv('titanic_train.csv')
titanic_pclass = titanic_df['Pclass']
print(type(titanic_pclass))
'''
<class 'pandas.core.series.Series'>
'''

value_counts = titanic_pclass.value_counts()
print(type(value_counts))
'''
<class 'pandas.core.series.Series'>
'''
print(value_counts)
'''
3    491
1    216
2    184
Name: Pclass, dtype: int64
'''

titanic_pclass.head()
'''
0      3
1      1
2      3
3      1
4      3
      ..
886    2
887    1
888    3
889    1
890    3
Name: Pclass, Length: 891, dtype: int64
'''
DataFrame['칼럼명']은 Series 형태로 특정 칼럼 데이터 세트가 반환됩니다. Series 객체에 value_counts() 메서드를 호출하면 해당 칼럼 값의 유형과 건수를 확인할 수 있습니다.
value_counts()는 Series 객체에서만 정의된 메서드입니다.
value_counts()의 반환 결과를 보면 Pclass값 3이 491개, 1이 216개, 2가 184개로 많은 순서대로 정렬해 값을 반환합니다.
반환 결과 역시 Series 객체입니다. 이때 3, 1, 2가 Series의 Index값으로 들어가 있습니다.
인덱스는 고유성이 보장된다면 의미있는 데이터값 할당도 위처럼 가능합니다. DataFrame, Series가 만들어진 후에도 변경 가능하고, 문자열도 가능합니다.
titanic_pclass.head()의 결과를 보면 왼쪽은 DataFrame의 인덱스와 동일한 Series의 인덱스를 반환합니다.
오른쪽은 Series의 해당 칼럼의 데이터값입니다.
DataFrame을 ndarray, 리스트, 딕셔너리로 상호 변환
판다스 DataFrame 객체의 생성 인자 중 data는 리스트, 딕셔너리, ndarray 중 하나를 입력받고, columns는 칼럼명 리스트를 입력받아 DataFrame을 생성할 수 있다. (칼럼명을 지정하지 않으면 자동으로 할당함)
DataFrame은 행과 열을 가지는 2차원 데이터입니다. 따라서 2차원 이하의 데이터들만 DataFrame으로 변환될 수 있다.
딕셔너리 형의 경우 key는 칼럼명으로, value(값)는 키에 해당하는 칼럼 데이터로 변환됩니다. 따라서 key는 문자열, value는 리스트(또는 ndarray) 형태로 딕셔너리를 구성합니다.
import numpy as np
import pandas as pd

col_name1 = ['col1']
list1 = [1, 2, 3]
array1 = np.array(list1)
print(array1.shape)
'''
(3,)
'''
#리스트를 이용해 DataFrame 생성
df_list1 = pd.DataFrame(list1, columns=col_name1)
print(df_list1)
'''
   col1
0     1
1     2
2     3
'''
#ndarray를 이용해 DataFrame 생성
df_array1 = pd.DataFrame(array1, columns=col_name1)
print(df_array1)
'''
   col1
0     1
1     2
2     3
'''
#2차원 형태의 데이터를 DataFrame으로 생성
#3개의 컬럼명
col_name2=['col1', 'col2', 'col3']

# 2행x3열 형태의 리스트와 ndarray를 생성한 뒤 DataFrame으로 변환
list2 = [[1, 2, 3], [11, 12, 13]]
array2 = np.array(list2)
df_list2 = pd.DataFrame(array2, columns=col_name2)
print(df_list2)
'''
   col1  col2  col3
0     1     2     3
1    11    12    13
'''

df_array2 = pd.DataFrame(array2, col_name2)
print(df_array2)
'''
   col1  col2  col3
0     1     2     3
1    11    12    13
'''

#key는 문자열 칼럼명, value는 리스트나 ndarray
dict = {'col1':[1, 11], 'col2':[2, 22], 'col3':[3, 33]}
df_dict = pd.DataFrame(dict)
print(df_dict)
'''
   col1  col2  col3
0     1     2     3
1    11    22    33
'''
DataFrame.values
import numpy as np
import pandas as pd

#key는 문자열 칼럼명, value는 리스트나 ndarray
dict = {'col1':[1, 11], 'col2':[2, 22], 'col3':[3, 33]}
df_dict = pd.DataFrame(dict)

array3 = df_dict.values
print(type(array3), array3.shape)
'''
<class 'numpy.ndarray'> (2, 3)
'''

print(array3)
'''
[[ 1  2  3]
 [11 22 33]]
'''

# DataFrame을 리스트로 변환
list3 = df_dict.values.tolist()
print(type(list3), list3)
'''
<class 'list'> [[1, 2, 3], [11, 22, 33]]
'''

# DataFrame을 딕셔너리로 변환
dict3 = df_dict.to_dict('list')
print(type(dict3), dict3)
'''
<class 'dict'> {'col1': [1, 11], 'col2': [2, 22], 'col3': [3, 33]}
'''
DataFrame.values는 DataFrame을 ndrarray로 변환해줍니다.
DataFrame에서 리스트는 DataFrame.values에서 tolist()를 호출하면 된다.
DataFrame에서 딕셔너리의 변환을 DataFrame.to_dict()를 호출하면 된다. 이때 인자 값으로는 value의 형을 적으면 된다.
DataFrame의 칼럼 데이터 세트 생성과 수정
import numpy as np
import pandas as pd

titanic_df = pd.read_csv('titanic_train.csv')
#Age0이라는 column을 추가하고 초기값을 0으로 줌
titanic_df['Age0']=0
titanic_df.head(3)
'''결과1'''

titanic_df['Age_by_10'] = titanic_df['Age']*10
titanic_df['Family_No'] = titanic_df['SibSp'] + titanic_df['Parch']+1
titanic_df.head(3)
'''결과2'''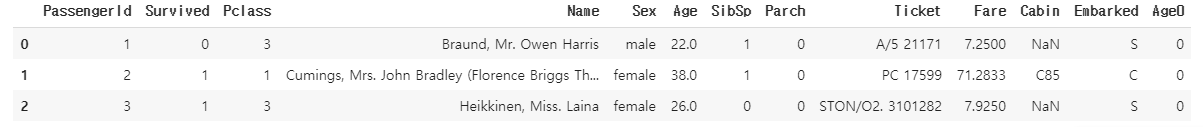
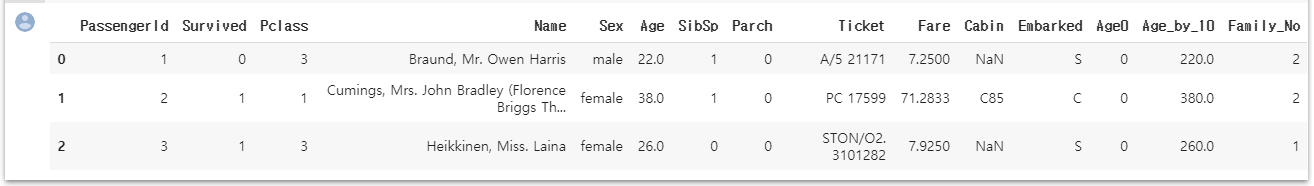
'Age0'이라는 이름과 0의 데이터 값을 가진 Series가 기존 DataFrame에 추가됐다.
Series=0과 같이 상숫값을 할당하면 모든 데이터 세트에 일괄적으로 적용됩니다.
기존의 Data도 DataFrame['column명']으로 Series형태로 불러올 수 있고, 이를 연산해 쉽게 column을 수정할 수 있다.
DataFrame.drop()
DataFrame.drop()의 원형은
DataFrame.drop(labels=None, axis=0, index=None, columns=None, level=None, inplace=False, errors='raise')이다.
가장 중요한 파라미터는 labels, axis, inplace이다.
axis=0은 Row축 방향으로 drop을 하겠다는 의미이므로 행을 없앱니다. 여기서 labels에 들어오는 값을 index로 간주함
axis=1은 columns을 drop하겠다는 의미입니다. labels는 column의 이름으로 간주합니다. 리스트로 입력해도 된다.
Inplace는 원본 데이터를 바꿀 것인가를 의미한다. default는 False로 돼있다. inplace=True로 설정하면, 반환값을 자기 자신의 객체로 할당하면 안됩니다. titanic_df = titanic_df.drop(['Age0', 'Age_by_10', 'Family_No'], axis=1, inplace=True)로 한다면, titanic_df 객체 변수를 아예 None으로 만들어 버립니다.
import numpy as np
import pandas as pd

titanic_drop_df = titanic_df.drop('Age0', axis=1)
titanic_drop_df.head(3)
'''결과3'''

drop_result = titanic_df.drop(['Age0', 'Age_by_10', 'Family_No'], axis=1, inplace=True)
print(drop_result)
'''None'''
titanic_df.head(3)
'''결과4'''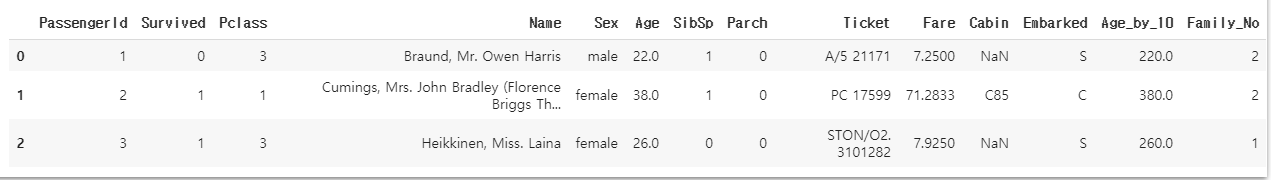
DataFrame.drop()을 통해 Row 지우기
import numpy as np
import pandas as pd
pd.set_option('display.width', 1000)
pd.set_option('display.max_colwidth', 15)
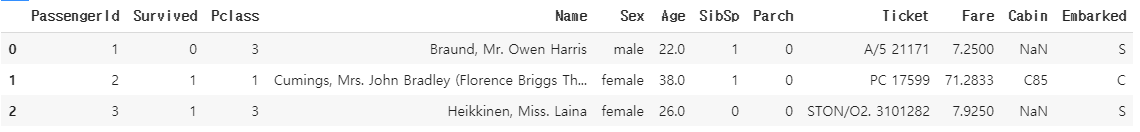
print('### before axis 0 drop ###')
print(titanic_df.head(3))
titanic_df.drop([0, 1, 2], axis=0, inplace=True)
print('### after axis 0 drop ###')
print(titanic_df.head(3))
'''
### before axis 0 drop ###
PassengerId Survived Pclass ... Fare Cabin Embarked
0 1 0 3 ... 7.2500 NaN S
1 2 1 1 ... 71.2833 C85 C
2 3 1 3 ... 7.9250 NaN S
[3 rows x 12 columns]
### after axis 0 drop ###
PassengerId Survived Pclass ... Fare Cabin Embarked
3 4 1 1 ... 53.1000 C123 S
4 5 0 3 ... 8.0500 NaN S
5 6 0 3 ... 8.4583 NaN Q
[3 rows x 12 columns]
'''
Index 객체
DataFrame.index, Series.index
import numpy as np
import pandas as pd

# 원본 파일 다시 로딩
titanic_df = pd.read_csv('titanic_train.csv')

# Index 객체 추출
indexes = titanic_df.index
print(indexes)
'''
RangeIndex(start=0, stop=891, step=1)
'''

# Index 객체를 실제 값 array로 변환
print(indexes.values)
'''
[  0   1   2   3   4   5   6   7   8   9  10  11  12  13  14  15  16  17
 .......................................................................
 882 883 884 885 886 887 888 889 890]
'''
print(type(indexes.values))
''' <class 'numpy.ndarray'> '''
print(indexes.values.shape)
''' (891,) '''
print(indexes[:5].values)
''' [0 1 2 3 4] '''
print(indexes.values[:5])
''' [0 1 2 3 4] '''
print(indexes[6])
''' 6 '''Index 객체는 식별성 데이터를 1차원 array로 가지고 있습니다. 또한, ndarray와 유사하게 단일 값 및 슬라이싱 반환도 가능합니다.
하지만, 한 번 만들어진 DataFrame 및 Series의 Index 객체는 함부로 변경할 수 없습니다.
indexes[0] = 5
'''
TypeError: Index does not support mutable operations
'''
즉, indexes[0] = 5를 수행할 수 없습니다.
Series의 연산 및 DataFrame.reset_index()
series의 Index는 오로지 식별용으로만 사용된다. 연산에서는 사용 안됨
import numpy as np
import pandas as pd

titanic_df = pd.read_csv('/titanic_train.csv')
series_fair = titanic_df['Fare']
print(series_fair.max())
'''
512.3292
'''
print(series_fair.sum())
'''
28693.9493
'''
print(sum(series_fair))
'''
28693.949299999967
'''
# series의 value에 3을 더한 것
print((series_fair + 3).head(3))
'''
0    10.2500
1    74.2833
2    10.9250
Name: Fare, dtype: float64
'''
titanic_reset_df = titanic_df.reset_index(inplace=False)
titanic_reset_df.head(3)
'''결과1'''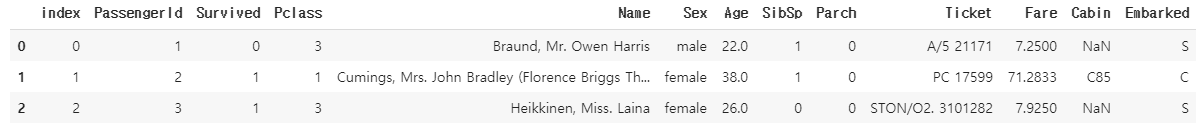
DataFrame 및 Series에 reset_index() 메서드를 수행하면, 세롭게 인덱스를 할당합니다. 기존 인덱스는 index라는 새로운 칼럼명으로 추가합니다. 반환되는 값은 DataFrame, Series 모두 DataFrame으로 반환됩니다. reset_index() 파라미터 중 drop= True로 설정하면, 기존 인덱스는 칼럼에 추가되지 않고 삭제(drop)됩니다.
Series.reset_index()
import numpy as np
import pandas as pd

titanic_df = pd.read_csv('/titanic_train.csv')

# sereis.reset_index()
print('### Before reset_index ###')
value_counts = titanic_df['Pclass'].value_counts()
print(value_counts)
print(type(value_counts))

new_value_counts = value_counts.reset_index(inplace=False)
print('### After reset_index ###')
print(new_value_counts)
print(type(new_value_counts))
#결과
'''
### Before reset_index ###
3    491
1    216
2    184
Name: Pclass, dtype: int64
<class 'pandas.core.series.Series'>
### After reset_index ###
   index  Pclass
0      3     491
1      1     216
2      2     184
<class 'pandas.core.frame.DataFrame'>
'''
데이터 셀렉션 및 필터링
DataFrame[ ]
ndarray[ ]와 달리 DataFrame[ ]에는 칼럼명이나 그것이 담긴 list 객체를 이용할 수 있습니다.
index를 넣을 경우 error가 발생한다.
import numpy as np
import pandas as pd
titanic_df = pd.read_csv('/train.csv')

print(titanic_df['Pclass'].head(3))
'''
0    3
1    1
2    3
Name: Pclass, dtype: int64
'''
print(titanic_df[['Survived', 'Pclass']].head(3))
'''
   Survived  Pclass
0         0       3
1         1       1
2         1       3
'''
print(titanic_df[0])
'''
error
'''
판다스의 인덱스 형태로 변환 가능한 표현식은 [ ] 내에 입력할 수 있습니다. DataFrame[0:2]와 같은 슬라이싱은 원하는 결과를 반환합니다.
titanic_df[0:2]
''' 결과1 '''
불린 인덱싱 표현도 가능합니다. 불린 표현식이 DataFrame['column'] == something임에 유의하십시요.
titanic_df[ titanic_df['Pclass'] ==3 ].head(3)
''' 결과2 '''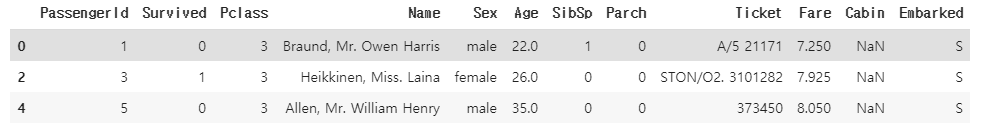
DataFrame.iloc[ ]
위치 기반 인덱싱은 행과 열 값으로 integer 또는 integer형의 슬라이싱, 팬시 리스트 값을 입력해줘야 합니다. 불린 인덱싱은 제공하지 않습니다.
import numpy as np
import pandas as pd
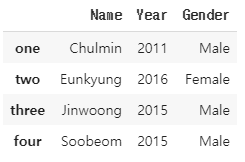
data = {'Name': ['Chulmin', 'Eunkyung', 'Jinwoong', 'Soobeom'],
'Year': [2011, 2016, 2015, 2015],
'Gender': ['Male', 'Female', 'Male', 'Male']
}
data_df = pd.DataFrame(data,index=['one', 'two', 'three', 'four'])
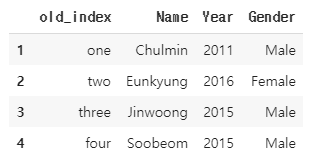
# data_df를 reset_index()로 새로운 숫자형 인덱스를 생성
data_df_reset = data_df.reset_index()
data_df_reset = data_df_reset.rename(columns={'index':'old_index'})
# 인덱스값에 1을 더해서 1부터 시작하는 새로운 인덱스값 생성
data_df_reset.index = data_df_reset.index + 1
# 위치 기반 인덱싱
data_df.iloc[0, 0]
'''
'Chulmin'
'''
data_df_reset.iloc[0, 1]
'''
'Chulmin'
'''
DataFrame.loc[ ]
Lable(명칭)기반 인덱싱은 칼럼의 명칭을 기반으로 위치를 지정하는 방식입니다. 인덱스가 문자열일 경우 문자열을 입력해야 합니다. 인덱스의 명칭(값)을 기반으로 하기 때문에 case 3과 같이 없는 값을 입력하면 error가 발생합니다.
data_df.loc['one', 'Name']
'''
'Chulmin'
'''

data_df_reset.loc[1, 'Name']
'''
'Chulmin'
'''

# case 3
data_df_reset.loc[0, 'Name']
'''
error
'''
DataFrame.iloc[ ]과 DataFrame.loc[ ]의 비교
print(data_df.iloc[0:1, 0])
'''
one    Chulmin
Name: Name, dtype: object
'''

print(data_df.loc['one': 'two', 'Name'])
'''
one     Chulmin
two    Eunkyung
Name: Name, dtype: object
'''
iloc을 슬라이싱 할 경우, 종료값 -1까지 출력하는데 반해, loc의 경우엔 종료값까지 포함해 출력한다. 명칭 기반의 경우 인덱스가 숫자형이 아닐 경우 (종료값-1)이 정의되지 않을 수 있기 때문이다.
DataFrame.loc[]의 경우 인덱스가 숫자형일 경우 종료값을 포함해 출력합니다.
print(data_df_reset.loc[1:2, 'Name'])
'''
Chulmin
Eunkyung
'''
불린 인덱싱
불린 인덱싱으로 얻은 반환 값은 DataFrame형이다.
import numpy as np
import pandas as pd

titanic_df = pd.read_csv('/train.csv')
titanic_boolean = titanic_df[titanic_df['Age']>60]
print(type(titanic_boolean))
'''
<class 'pandas.core.frame.DataFrame'>
'''
titanic_boolean
'''
결과1
'''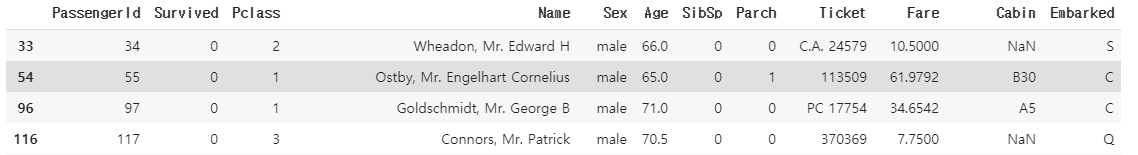
불린 인덱싱의 반환값이 DataFrame이므로, [column]을 붙혀 원하는 column만 출력할 수 있다.
loc의 경우 행과 열 위치에 불린 인덱싱과 list가 놓여야 한다.
titanic_df[titanic_df['Age']>60][['Name', 'Age']].head(3)
''' 결과2 '''

titanic_df.loc[titanic_df['Age']>60, ['Name', 'Age']].head(3)
''' 이것도 결과2 '''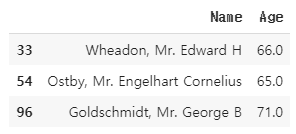
여러개의 복합 조건도 결합해 적용할 수 있습니다. and는 &, or는 |, Not은 ~로 나타냅니다.
titanic_df[ (titanic_df['Age']>60) & (titanic_df['Pclass']==1)& (titanic_df['Sex']=='female')]
''' 결과3 '''

# 개별 조건을 변수로 할당할 수도 있다.
cond1 = titanic_df['Age']>60
cond2 = titanic_df['Pclass']==1
cond3 = titanic_df['Sex']=='female'

titanic_df[ cond1 & cond2 & cond3 ]
''' 이것도 결과3 '''
정렬
DataFrame.sort_values(), Series.sort_values()
sort_values()의 주요 입력 파라미터는 by, ascending, inplace입니다.
by로 특정 칼럼을 입력하면 그 칼럼으로 정렬을 수행합니다.
ascending = True가 default이며, True일 경우 오름차순으로 정렬합니다. False면 내림차순으로 정렬합니다.
inplace = False가 default이며 ,True일 경우 원본을 바꾸며 None을 반환하고, False이면 원본 DataFrame은 그대로 유지한 채 정렬된 DataFrame을 반환합니다.
import numpy as np
import pandas as pd

titanic_df = pd.read_csv('train.csv')
titanic_sorted = titanic_df.sort_values(by=['Name'])
titanic_sorted.head(3)
'''결과1'''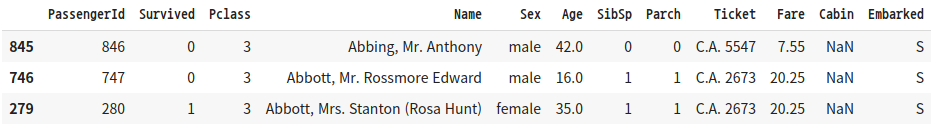
titanic_sorted = titanic_df.sort_values(by=['Pclass', 'Name'], ascending=False)
titanic_sorted.head(3)
'''결과2'''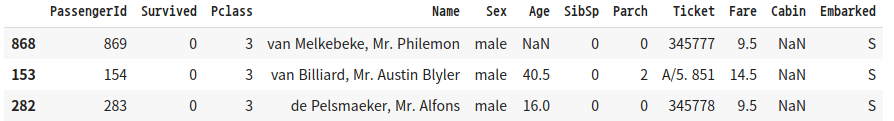
Aggregation
aggregation함수는 min(), max(), sum(), count()와 같은 것들이 있다. RDBM SQL의 aggregation함수의 적용과 유사하지만 다른 점은 DataFrame의 aggregation의 경우 모든 칼럼에 해당 aggregation을 적용한다는 점입니다.
titanic_df.count()
'''
PassengerId    891
Survived       891
Pclass         891
Name           891
Sex            891
Age            714
SibSp          891
Parch          891
Ticket         891
Fare           891
Cabin          204
Embarked       889
dtype: int64
'''
특정 칼럼에 aggregation 함수를 적용하기 위해서는 DataFrame에 대상 칼럼들만 추출해 aggregation을 수행하면 됩니다.
titanic_df[['Age', 'Fare']].mean()
'''
Age     29.699118
Fare    32.204208
dtype: float64
'''
DataFrame.groupby()
DataFrame에 groupby()를 호출하면 DataFrameGroupBy형의 DataFrame을 반환합니다.
titanic_groupby = titanic_df.groupby(by='Pclass')
print(type(titanic_groupby))
'''
<class 'pandas.core.groupby.generic.DataFrameGroupBy'>
'''
DataFrameGroupBy형에 aggregation 함수를 수행하면 groupby() 대상 컬럼을 제외한 모든 칼럼에서 aggregation 연산을 수행합니다.
titanic_groupby = titanic_df.groupby(by='Pclass').count()
titanic_groupby
'''결과3'''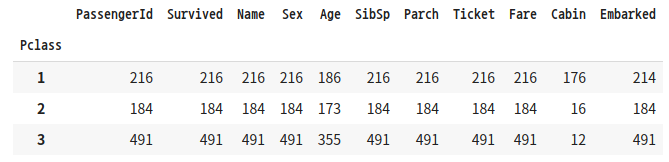
일부 칼럼만 수행하고 싶은 경우, DataFrameGroupBy 객체에 [['PassengerId', 'Survived']]로 필터링해 이 두 칼럼만 count()를 수행합니다.
titanic_groupby = titanic_df.groupby(by='Pclass')[['PassengerId', 'Survived']].count()
titanic_groupby
'''결과4'''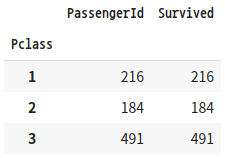
SQL의 경우 aggregation 함수명을 Select 절에 나열하기만 하면 되지만, DataFrameGroupBy 객체의 경우 agg() 내에 인자로 입력해서 사용합니다.
# SQL의 경우, Select max(Age), min(Age) from titanic_table group by Pclass
titanic_groupby = titanic_df.groupby(by='Pclass')['Age'].agg([max, min])

titanic_groupby
'''결과5'''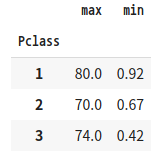
SQL의 경우 서로 다른 aggregation 함수를 쉽게 구현할 수 있지만, DataFrame.groupby()의 경우 딕셔너리 형태로 칼럼과 aggregation 함수 쌍을 입력해야 합니다.
# Select max(Age), sum(SibSp), avg(Fare) from titanic_table group by Pclass
agg_format = {'Age':'max', 'SibSp':'sum', 'Fare':'mean'}
titanic_groupby = titanic_df.groupby(by='Pclass').agg(agg_format)
titanic_groupby
'''결과6'''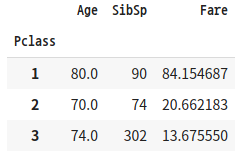
결손 데이터 처리하기
DataFrame.isna()
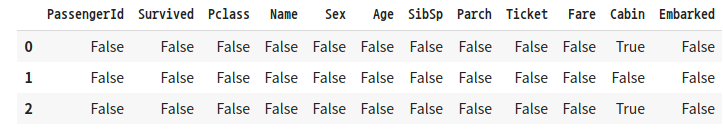
isna()는 데이터가 NaN인지 아닌지 여부를 알려줍니다. DataFrame.isna()는 모든 칼럼의 값이 NaN인지 아닌지를 True나 False로 알려줍니다. sum()함수를 통해 결손 데이터의 개수를 구할 수 있습니다. True는 1로 False는 0으로 변환됩니다.
titanic_df.isna().head(3)
'''결과1'''

#결손 데이터 갯수
titanic_df.isna().sum()
'''
PassengerId      0
Survived         0
Pclass           0
Name             0
Sex              0
Age            177
SibSp            0
Parch            0
Ticket           0
Fare             0
Cabin          687
Embarked         2
dtype: int64
'''
DataFrame.fillna()
fillna()함수는 결손 데이터, 즉 NaN 값을 다른 값으로 대체할 수 있습니다.
DataFrame.fillna()의 경우 반환 값을 titanic_df['Cabin'](Series나 DataFrame)로 받거나 반환 변숫값을 지정하지 않으려면 inplace=True로 파라미터를 추가해주어야 원본이 바뀝니다.
titanic_df['Cabin'] = titanic_df['Cabin'].fillna('C000')
titanic_df.head(3)
'''결과2'''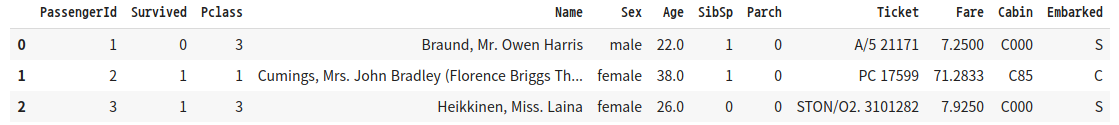
Age와 Embarked의 NaN값도 평균 나이와 'S'로 대체해보겠습니다.
titanic_df['Cabin'] = titanic_df['Cabin'].fillna('C000')
titanic_df['Age'] = titanic_df['Age'].fillna(titanic_df['Age'].mean())
titanic_df['Embarked'] = titanic_df['Embarked'].fillna('S')
titanic_df.isna().sum()
'''
PassengerId    0
Survived       0
Pclass         0
Name           0
Sex            0
Age            0
SibSp          0
Parch          0
Ticket         0
Fare           0
Cabin          0
Embarked       0
dtype: int64
'''
이제 NaN값이 없어졌습니다.
DataFrame.apply(lambda)
lambda식이란 파이썬에서 함수형 프로그래밍을 지원하기 위해 만들어졌습니다.
함수 선언이 한 줄로 간결하게 정리됩니다. ':'로 입력인자, 반환될 계산식을 분리합니다.
# lambda 설명
# 일반 함수
def get_square(a):
   return a**2

# lambda 식
lambda_square = lambda x : x**2
lambda식을 이용할 때, 보통 map()함수를 결합해서 사용합니다.
a=[1, 2, 3]
squares = map(lambda x : x**2, a)
list(Squares)
''' [1, 4, 9] '''
apply lambda식을 적용해 칼럼값을 계산해보겠습니다.
import numpy as np
import pandas as pd
titanic_df = pd.read_csv('/content/drive/MyDrive/military/train.csv')

# column 추가
titanic_df['Name_len'] = titanic_df['Name'].apply(lambda x: len(x))
titanic_df[['Name', 'Name_len']].head(3)
'''결과1'''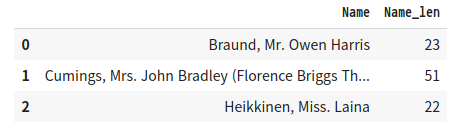
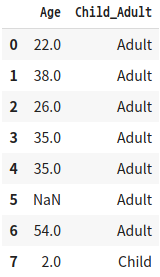
lambda식의 경우 if else문을 사용할 수 있습니다. ':' 오른편에 반환값이 있어야 하기 때문에 'Child' if x<=15 else 'Adult'처럼 작성해야합니다.
titanic_df['Child_Adult'] = titanic_df['Age'].apply(lambda x: 'Child' if x<=15 else 'Adult')
titanic_df[['Age', 'Child_Adult']].head(8)
'''결과2'''
else if는 지원하기 않기 때문에 else절을 ()로 내포해 다시 if else문을 적용해 사용합니다.
titanic_df['Age_cat'] = titanic_df['Age'].apply(lambda x : 'Child' if x<=15 else ('Adult' if x<=60 else 'Elderly'))
titanic_df['Age_cat'].value_counts()
'''
Adult      609
Elderly    199
Child       83
Name: Age_cat, dtype: int64
'''
else if가 많이 나와야 하는 경우나 switch case문 같은 경우는 별도의 함수를 만들어서 사용하는게 더 나을 수 있습니다.
def get_category(age):
  cat = ''
  if age <=5: cat = 'Baby'
  elif age <=12: cat = 'Child'
  elif age <=18: cat = 'Teenager'
  elif age <=25: cat = 'Student'
  elif age <=35: cat = 'Young Adult'
  elif age <=60: cat = 'Adult'
  else : cat = 'Elderly'

  return cat

# get_category는 'Age'칼럼에서 해당하는 cat 반환
titanic_df['Age_cat'] = titanic_df['Age'].apply(lambda x: get_category(x))
titanic_df[['Age', 'Age_cat']].head(8)
'''결과3'''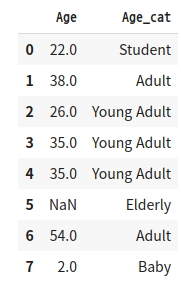
출처: 파이썬 머신러닝 완벽 가이드 (권민철)
'파이썬 머신 러닝 완벽 가이드' 카테고리의 다른 글
| 피마 인디언 당뇨병 예측 (0) | 2021.11.05 |
|---|---|
| 평가 (0) | 2021.10.27 |
| 타이타닉 생존자 예측 (0) | 2021.10.20 |
| 사이킷런 scikit-learn (0) | 2021.10.15 |
| Numpy (0) | 2021.10.09 |